Great Lakes Water Analysis Tool
Safe drinking water isn’t guaranteed—even in America. This interactive mapping platform shows how water infrastructure funding is allocated across the Great Lakes region and allows users to explore policy decisions that impact investments in clean water.
Role
Lead Designer & Front-End Developer
Responsibilities
UX Design • Visual Design • Mapping UX • Responsive Development • Data Communication
Project Highlights
- Collaborated with water policy experts and stakeholders to design an analytical tool that helps users understand local and state-wide water infrastructure funding and explore impacts of policy shifts.
- Led user research and iterative usability testing that informed user-centered design decisions throughout the project cycle.
- Transformed complex, multi-state funding criteria into an intuitive interface users can explore, compare, and modify.
- Data Visualization
- Front-End Design
- Interactive Maps
- UI UX Design
- User-Centered Design
- Wireframing
Project Partners
- Center for Neighborhood Technology
- Environmental Policy Innovation Center
Who uses this?
- Policymakers & Researchers
- Local governance
- Community leaders
- Community-based organizations
Visit the website:
Who gets to drink clean water?
A simple question with a complex answer.
Across the Great Lakes region, many communities live with unsafe water—not because solutions don’t exist, but because funding rules are confusing, and in some cases just don't apply where they probably should.
I designed this tool to make those rules more understandable and empower decision makers and community residents to explore what policy changes would result in a more equitable future.
Core Features
The tool empowers everyday residents, community advocates, policymakers, and researchers to:
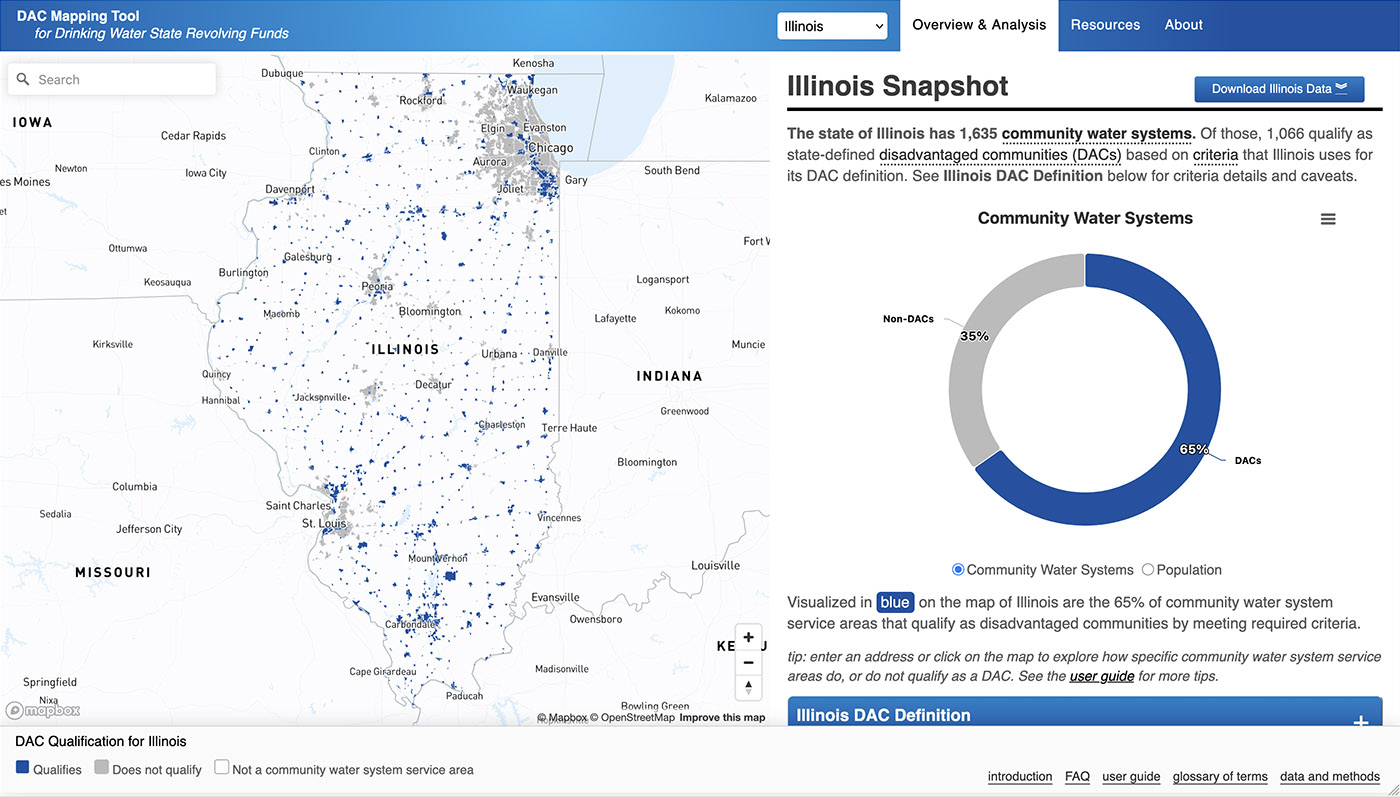
- See where water funding investments apply
- Understand how states define “Disadvantaged Communities"
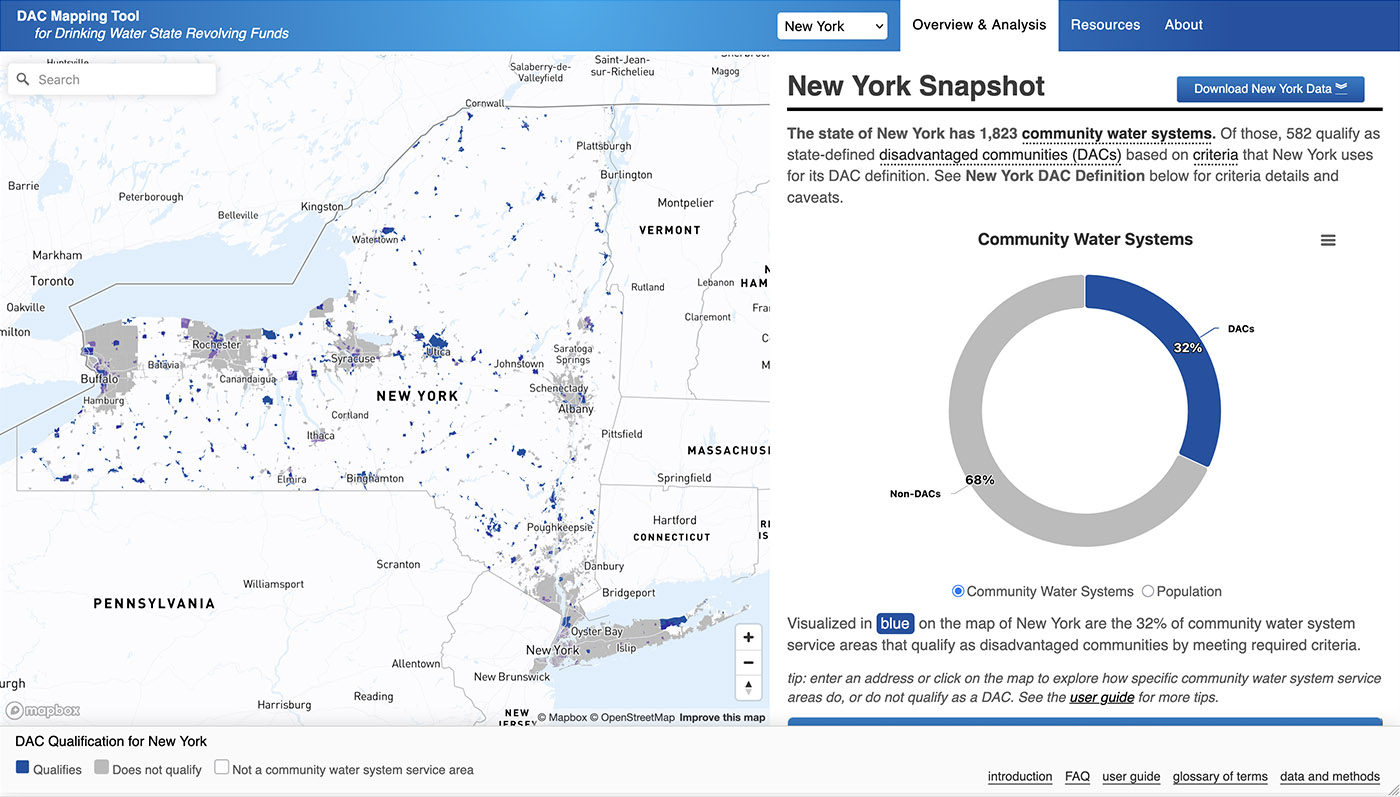
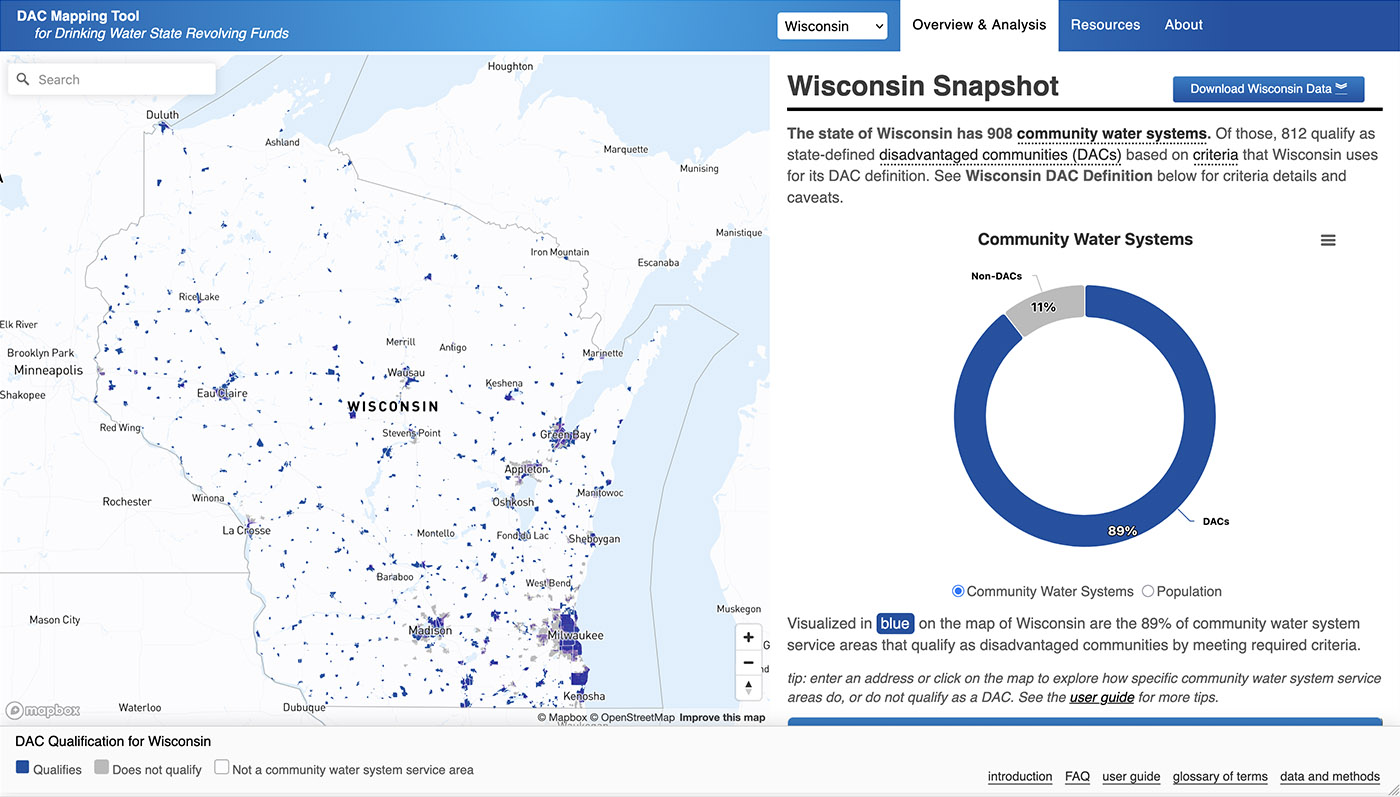
- Compare funding definition criteria across states
- Scenario test how changes would affect real-world outcomes
Instead of static reports, users get a living interface to explore the equity impacts of water policy decisions.
Making Complexity Accessible
Water funding policy is filled with technical terminology, formulas, and exceptions that even experts struggle to interpret.
My goal was to build a tool that policy professionals could use while remaining approachable to everyday residents.
Working closely with subject matter experts, I:
- distilled dense regulatory language into plain-language explanations
- designed interactive visualizations that replace spreadsheets and PDFs
- integrated tooltips, glossaries, and contextual help to guide new users
The result is a platform that invites exploration rather than intimidation.
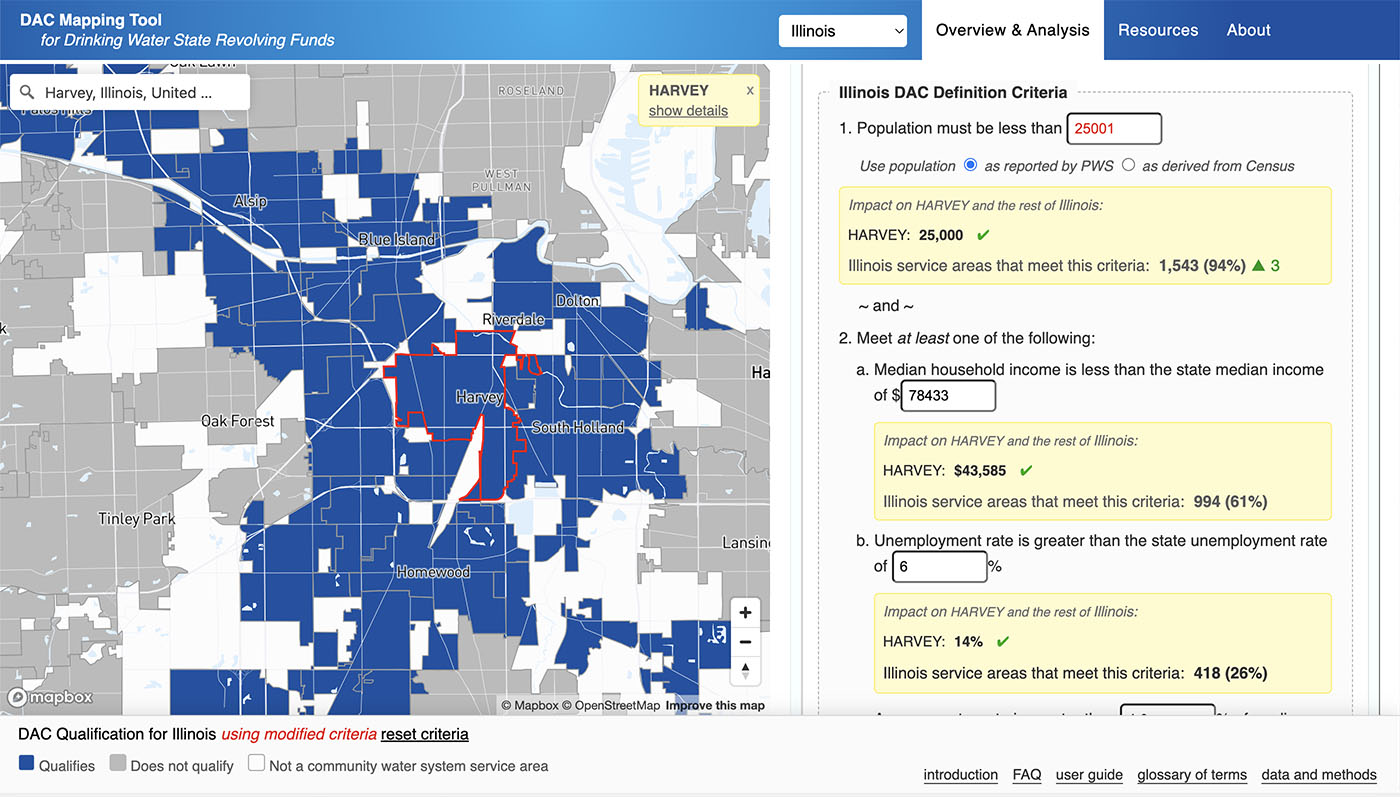
What a Difference a Change Can Make
Small policy details can have enormous real-world consequences.
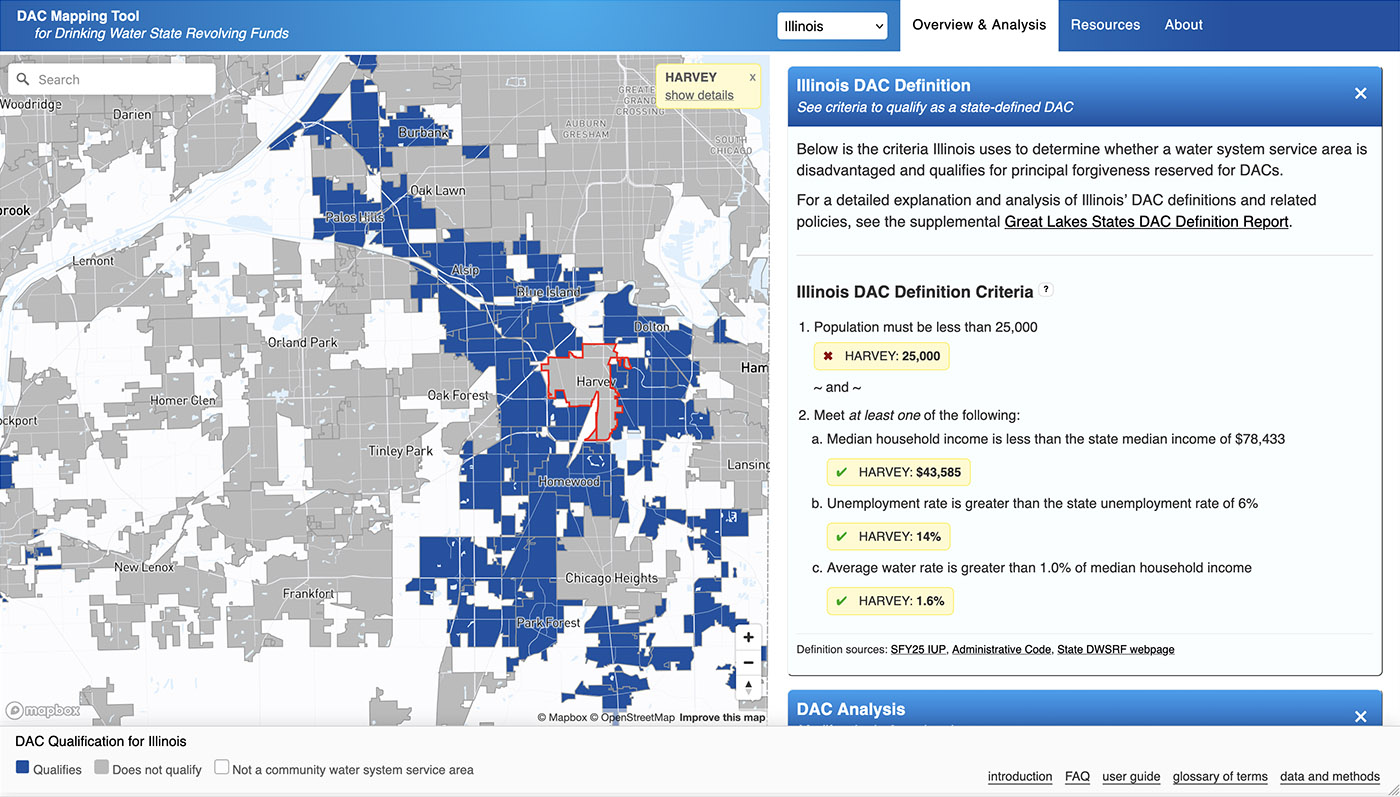
For example, the City of Harvey doesn't qualify for water infrastructure funding assistance because its reported population sits just one person above the eligibility threshold. Despite meeting every other criterion by sizable margins, the entire city is excluded.
By combining robust demographic data, eligibility rules, and interactive mapping, the tool allows users to see these inequities instantly and build evidence-based arguments for more equitable outcomes.
I designed features that let users:
- adjust eligibility criteria to instantly see how qualifications change
- compare one state’s criteria with those used by other states
- visualize changes at local and statewide scales
- explore “what-if” scenarios to support advocacy and policy discussions
These features help users see exactly how policy changes could impact the equitable distribution of funding.
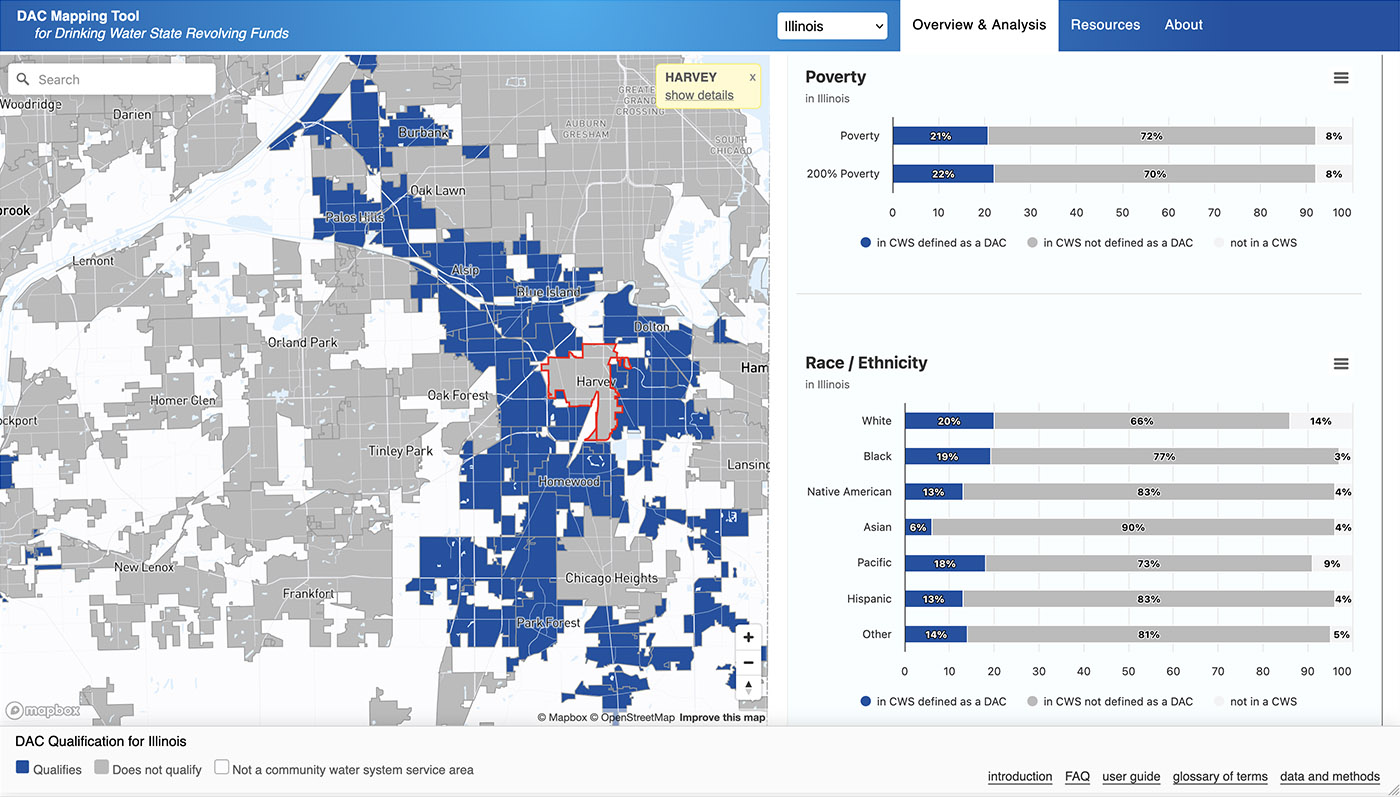
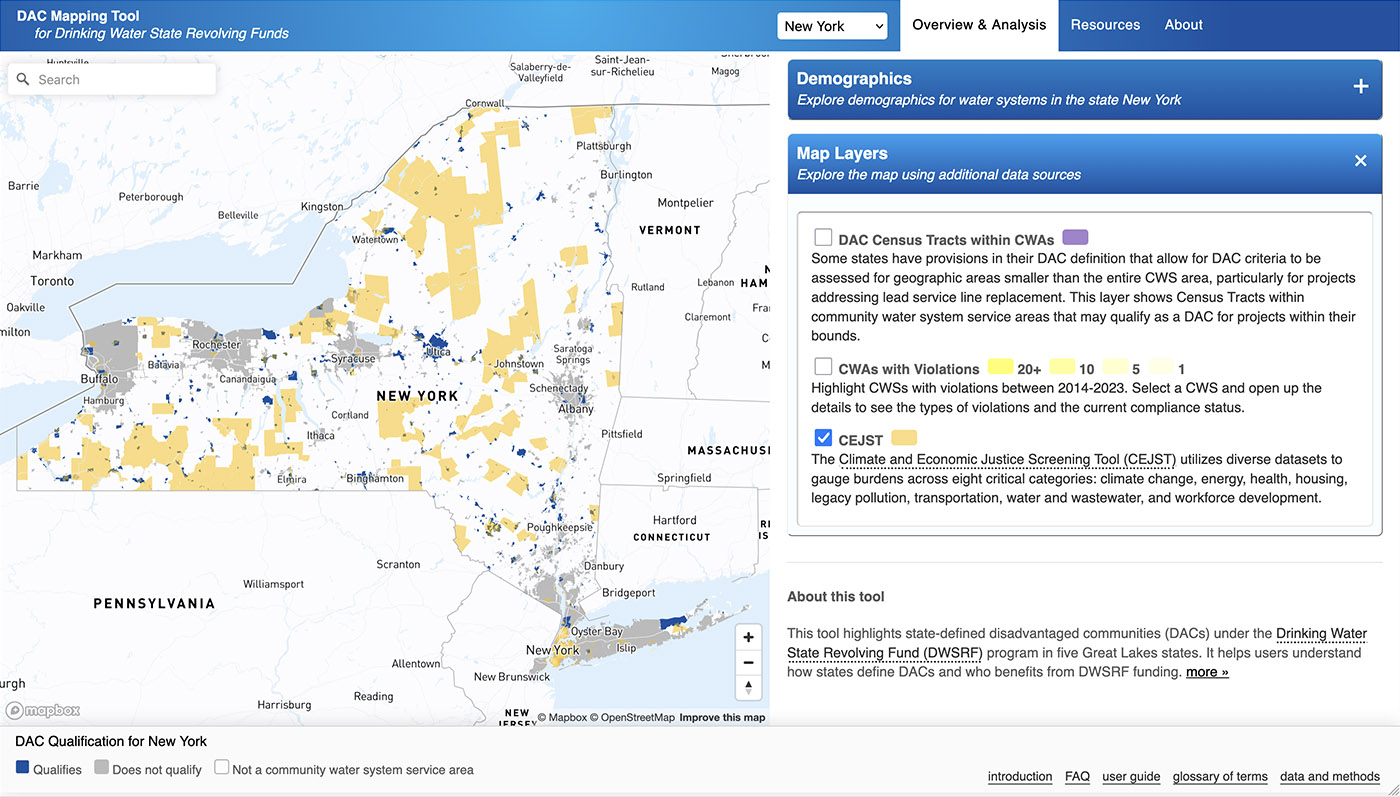
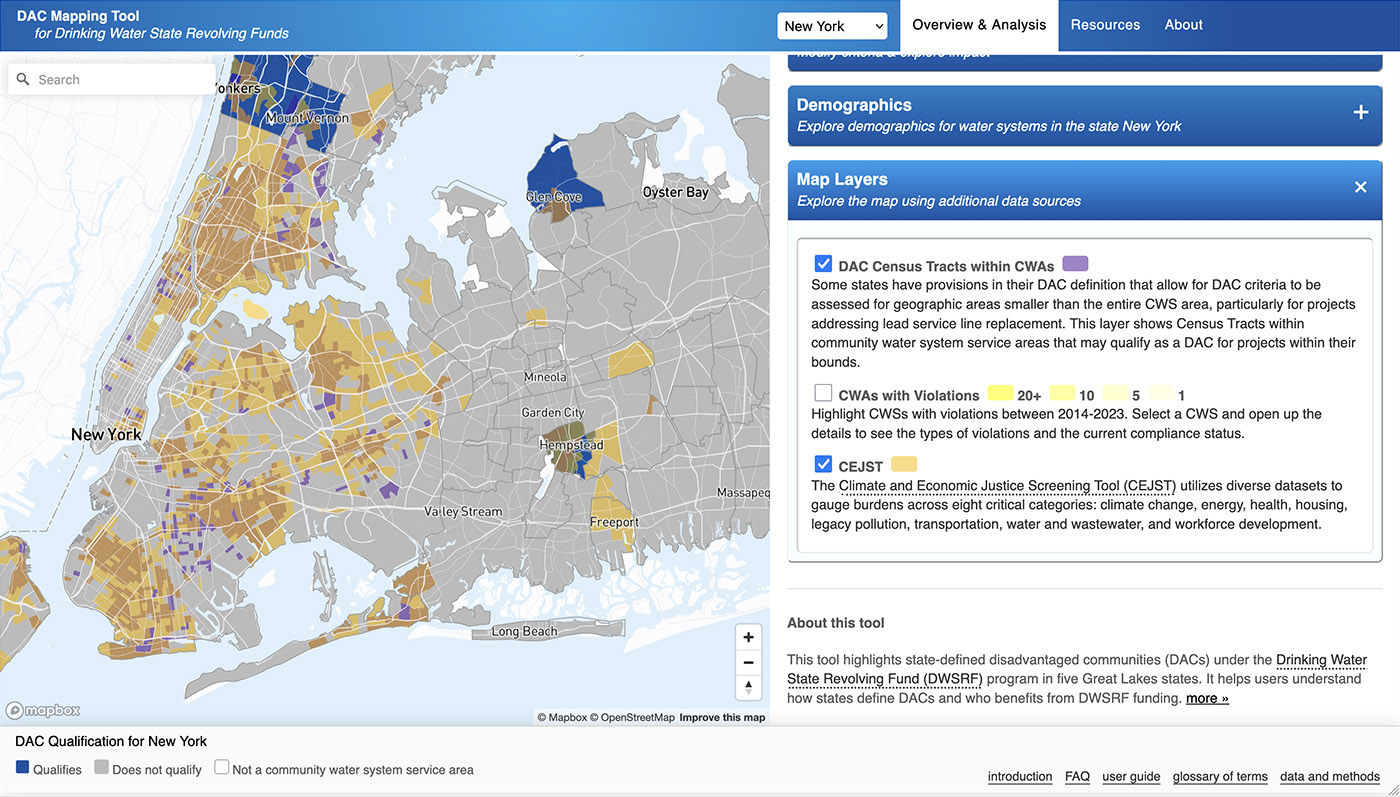
More Context Through Data
To deepen understanding, I incorporated additional spatial layers that highlight:
- communities with documented water violations
- areas with special policy provisions
- cumulative impact burdens across eight categories, including climate, health, housing, transportation, and legacy pollution
These layers give users a fuller picture of how funding decisions intersect with real community needs.
Outcome
The Great Lakes Water Analysis Tool equips advocates and decision-makers with a clearer, more transparent way to evaluate water funding policy—helping drive more equitable investment in safe drinking water.
Visit the website: