Urban Flooding Baseline
An interactive storytelling and mapping platform that helps residents, advocates, and policymakers understand where urban flooding occurs, why it happens, and which communities are most affected across the Calumet region of Cook County.
I led UX research, interactive design, and front-end development to transform complex environmental data into an accessible, community-centered decision-making tool.
Role
Lead Designer & Front-End Developer
Responsibilities
UX Design • Visual Design • Interactive Storytelling • Mapping UX • Responsive Development • Data Communication
Project Highlights
- Designed and developed an interactive civic data platform visualizing layered flood risk indicators across multiple municipalities
- Led UX research and usability testing with community stakeholders, translating findings into iterative interface improvements
- Created both exploratory map tools and guided narrative experiences to support technical and non-technical audiences
- Helped design a mobile-first community reporting app enabling residents to document flooding events in real time
- Combined institutional GIS datasets with community-sourced evidence to create a more human-centered view of flood risk
- Front-End Design
- Interactive Maps
- Interactive Storytelling
- UI UX Design
- User-Centered Design
Project Partners
- Center for Neighborhood Technology
- South Suburban Mayors & Managers Association
Audience
- Local governance
- Community leaders
- Community-based organizations
Visit the website:
The Challenge
Urban flooding is often invisible in official datasets—especially in under-resourced communities. Existing tools failed to capture the full relationship between infrastructure conditions, environmental risk factors, and lived community experiences.
The challenge was to design an accessible public-facing platform that could:
- Translate complex GIS and environmental datasets into understandable insights
- Help residents and municipalities identify localized flooding patterns
- Surface inequities in flooding impact and infrastructure vulnerability
- Support advocacy, planning, and community decision-making
User Experience Strategy
Early wireframes and interactive prototypes were used throughout user research and usability testing to evaluate content complexity, navigation patterns, and map interaction behavior across a wide range of users.
One key insight was the need to support two distinct audience types:
- Technical users seeking exploratory data tools
- Community users who benefited from guided, narrative-driven analysis
This led to the development of both an advanced interactive map interface and a simplified story-driven experience designed to make complex flooding data more approachable.
Interactive Map
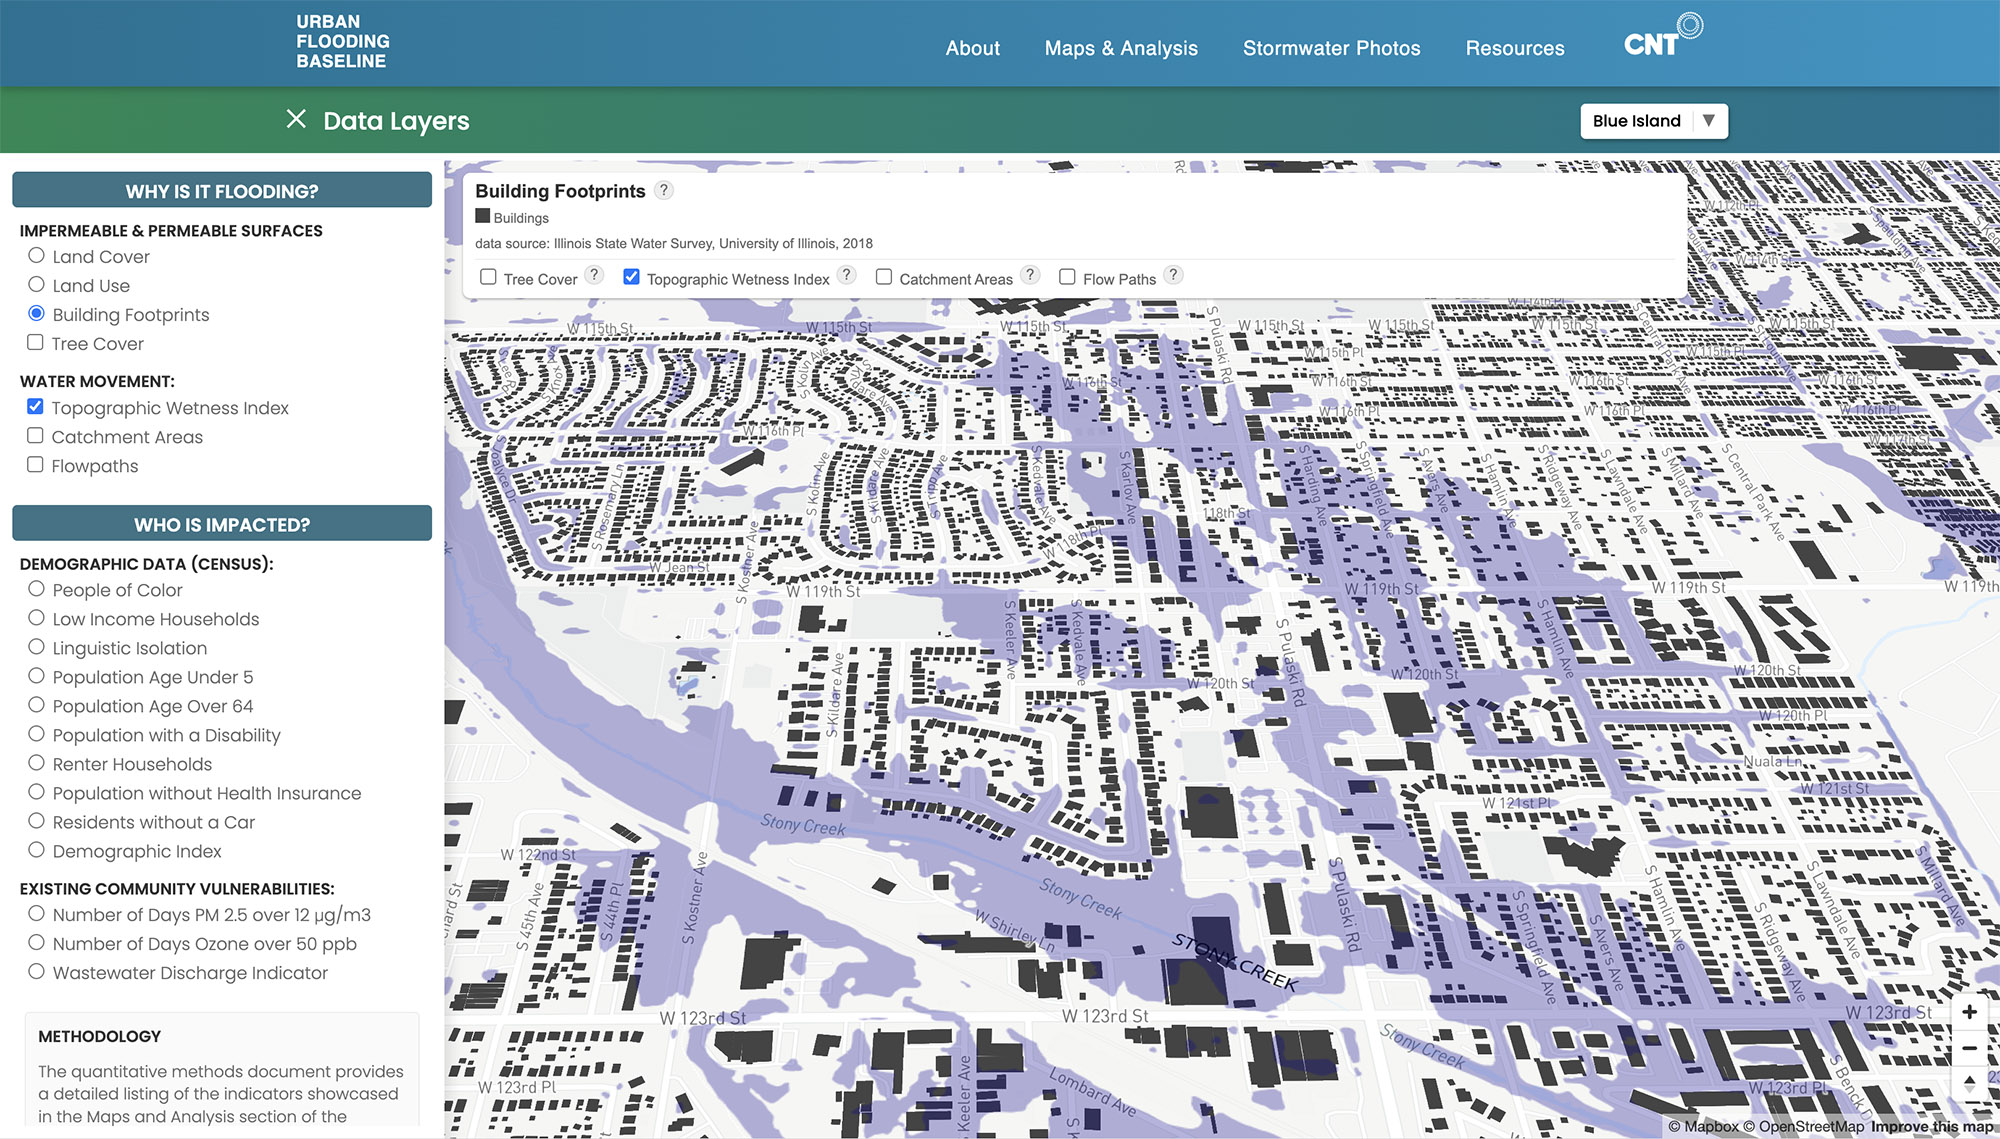
The interactive map experience was designed for exploratory analysis, allowing advanced users full agency to compare layered environmental, infrastructural, and demographic datasets across municipalities.
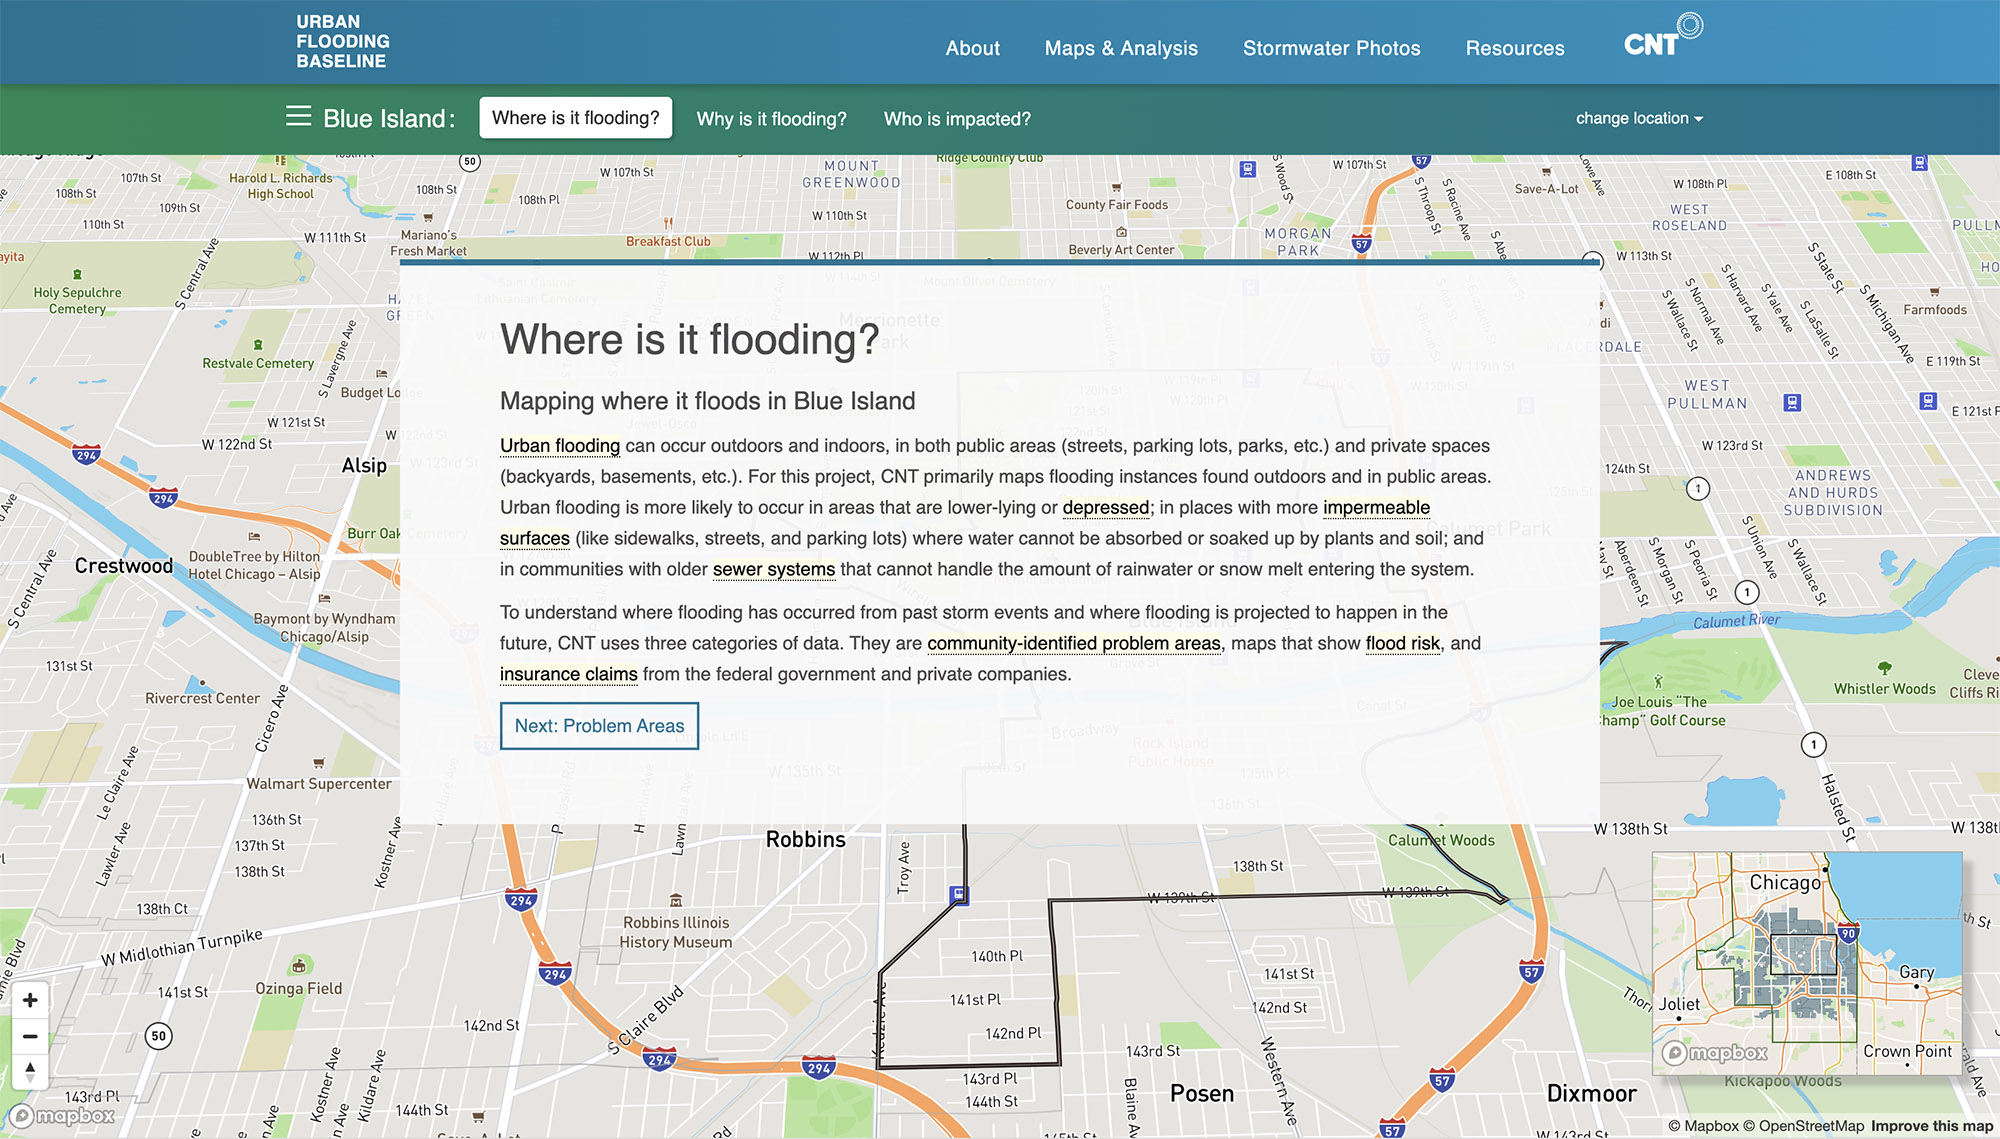
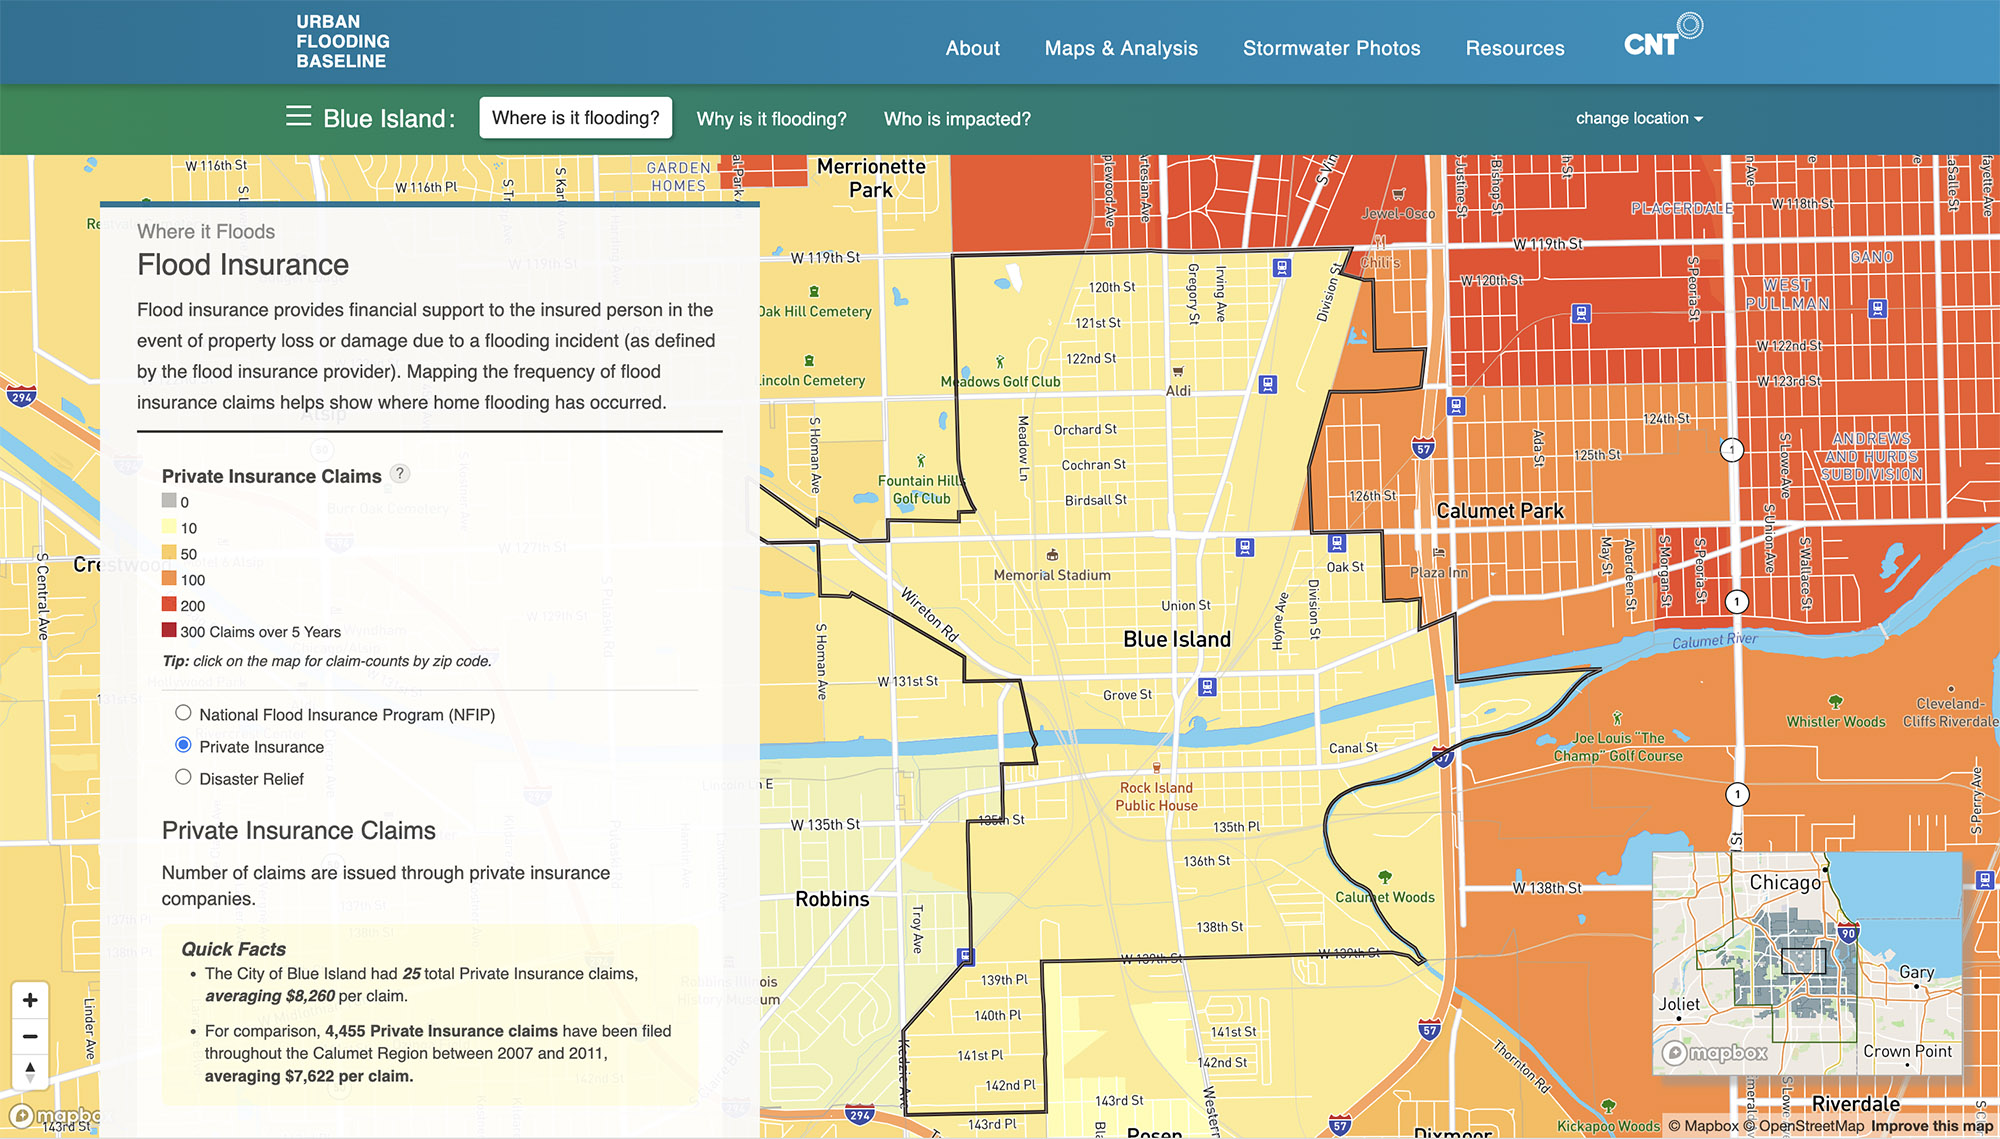
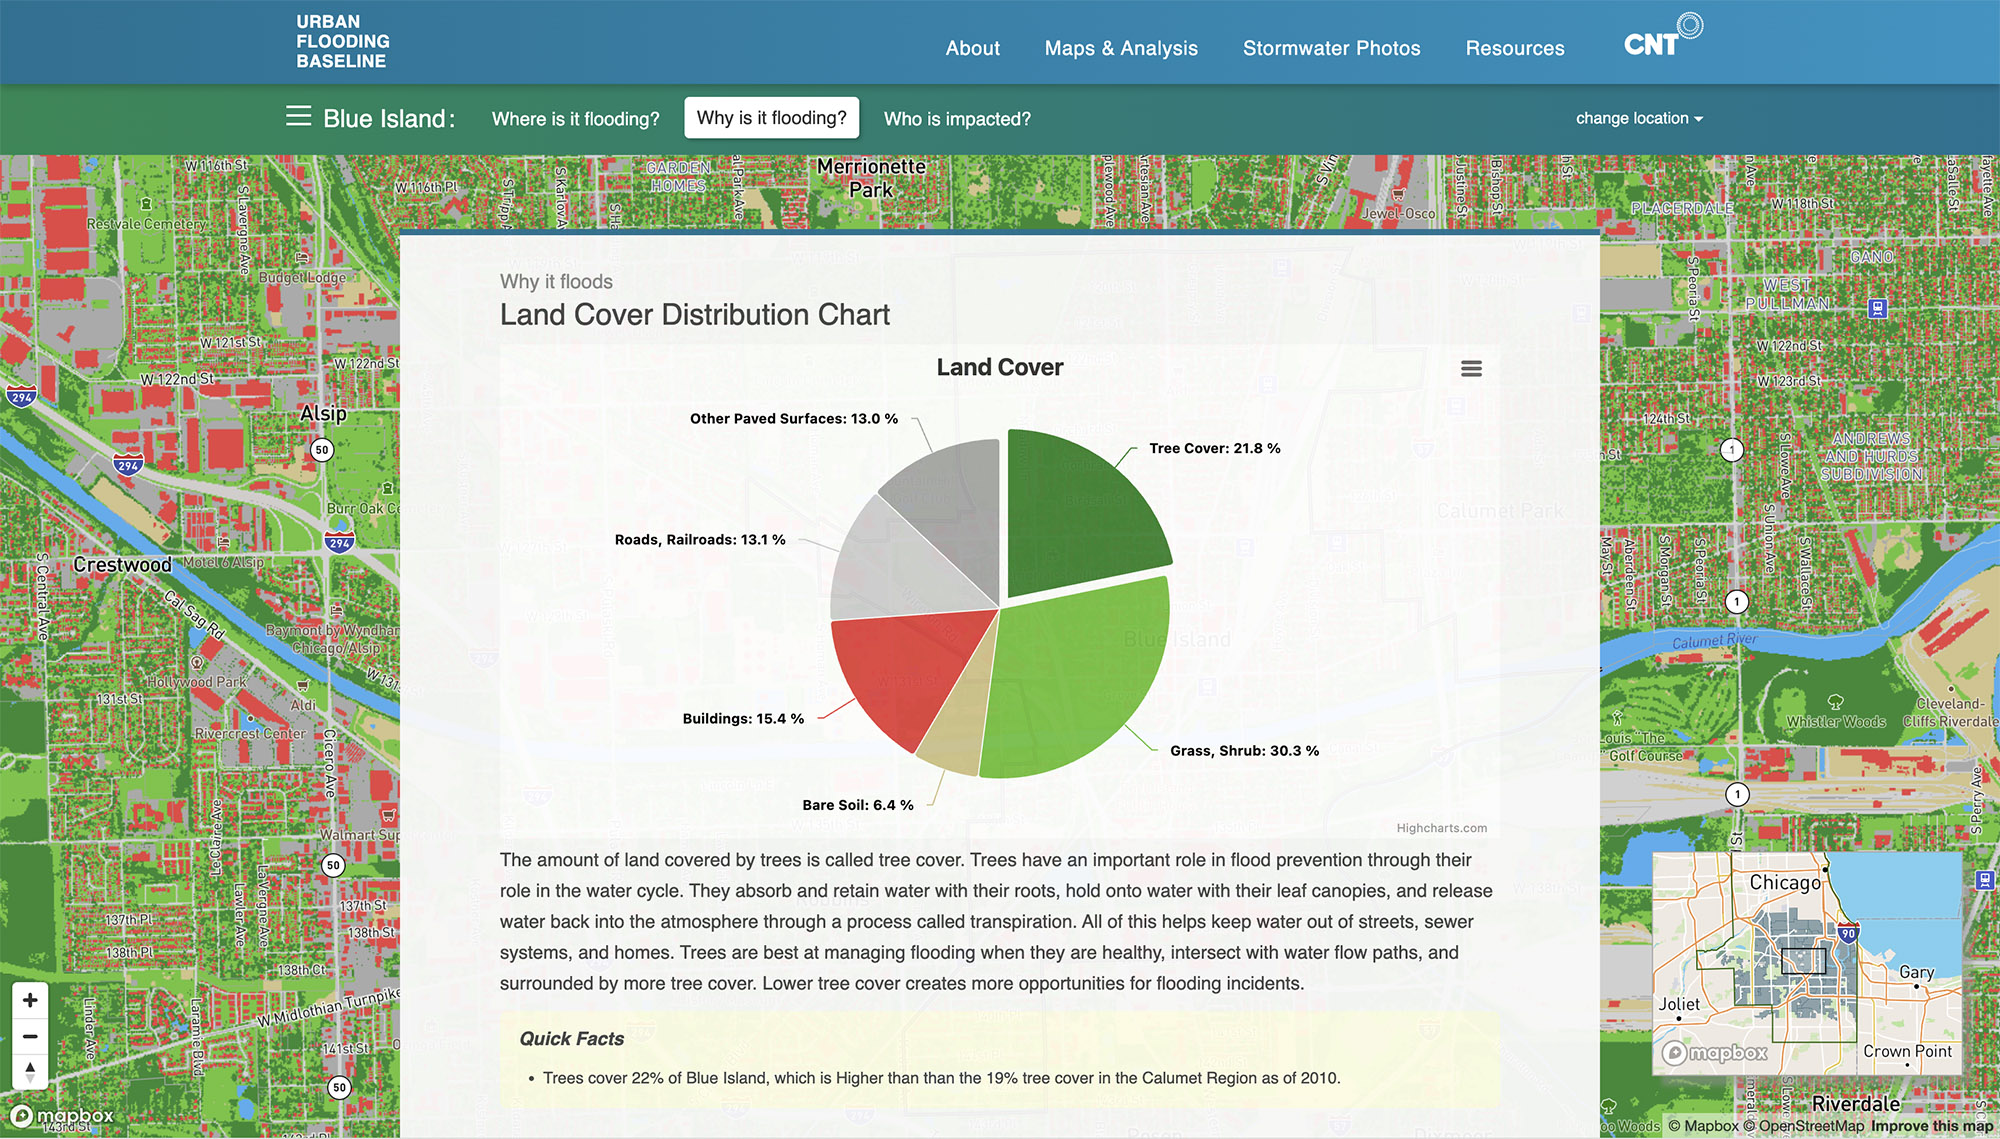
Guided Analysis
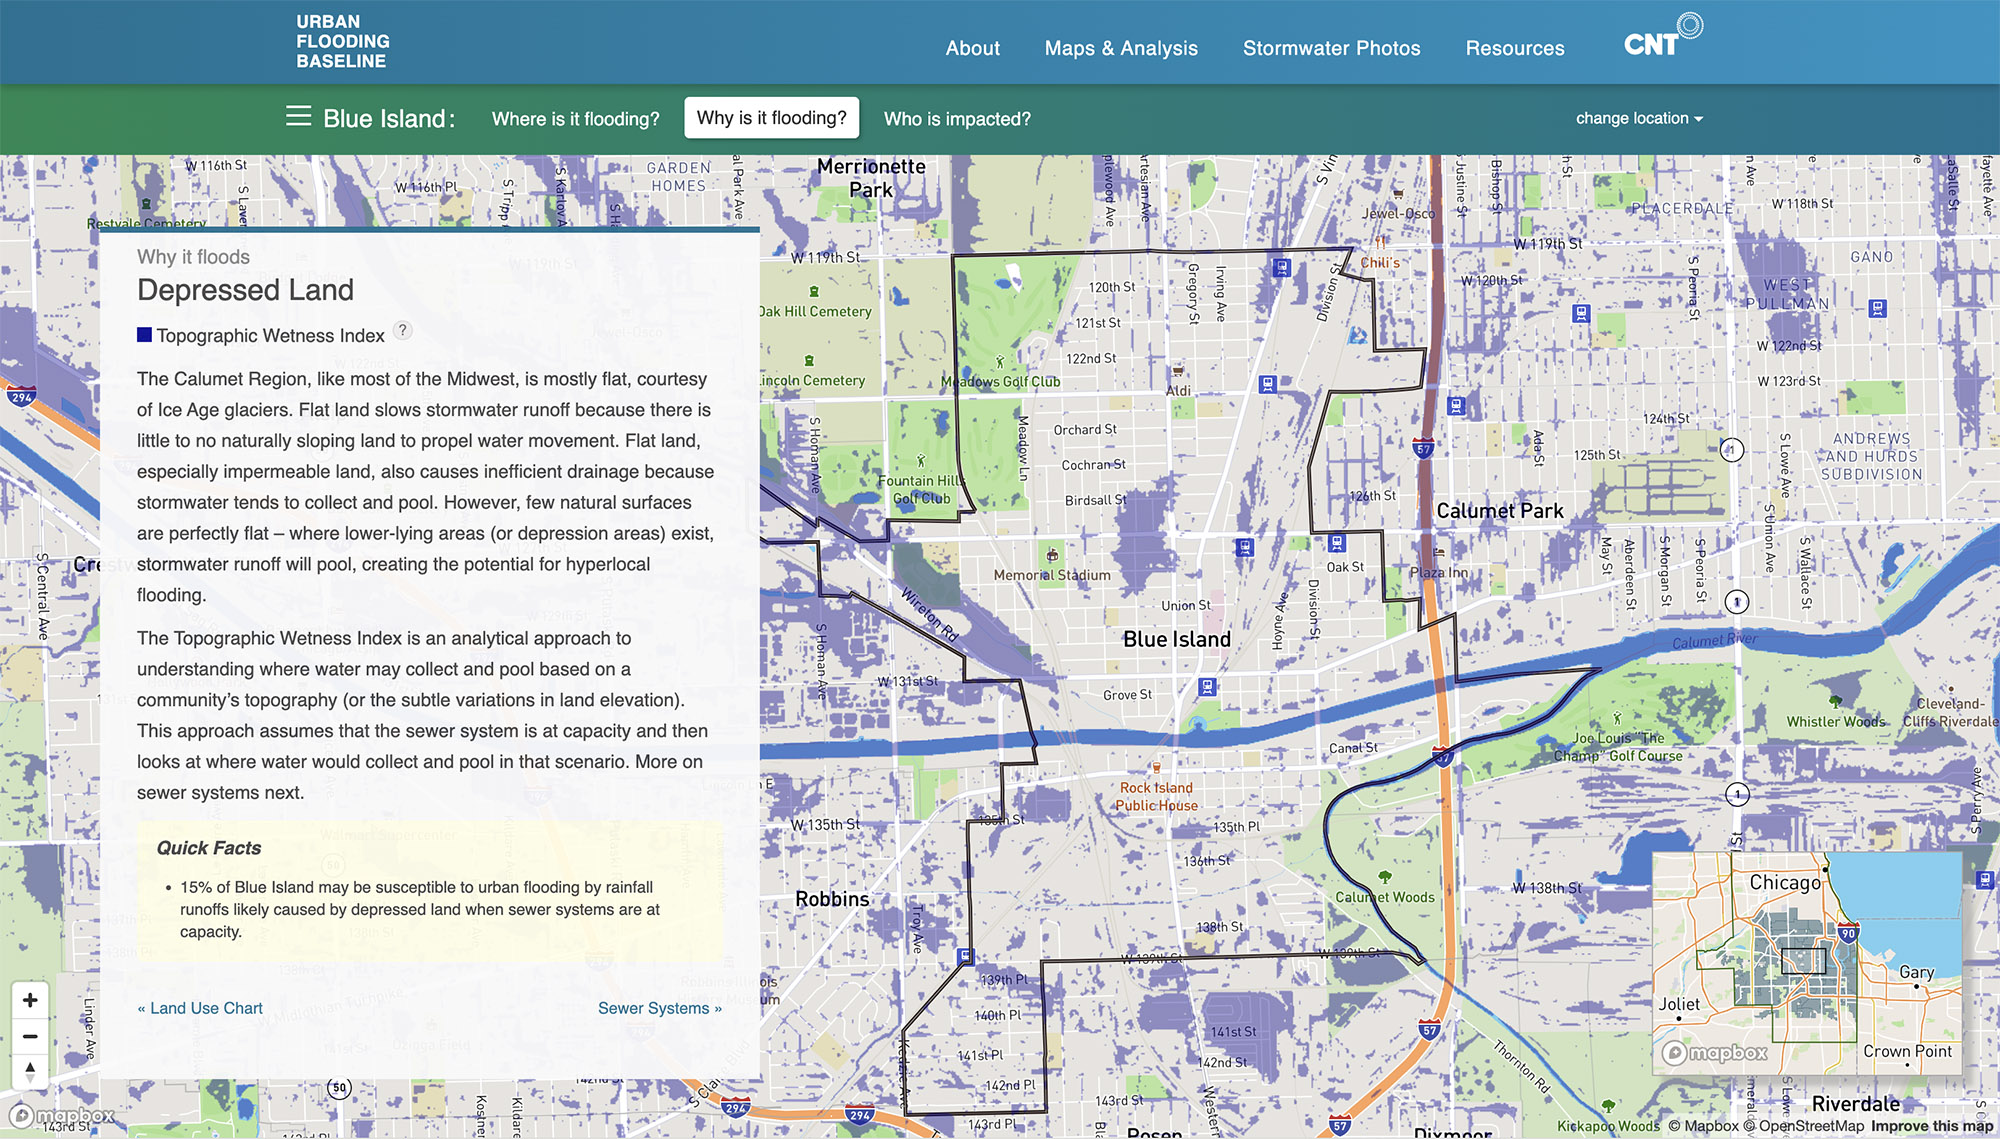
The guided analysis breaks large datasets into smaller narrative steps, introducing non-technical users to flooding patterns without becoming overwhelmed by GIS-style controls.
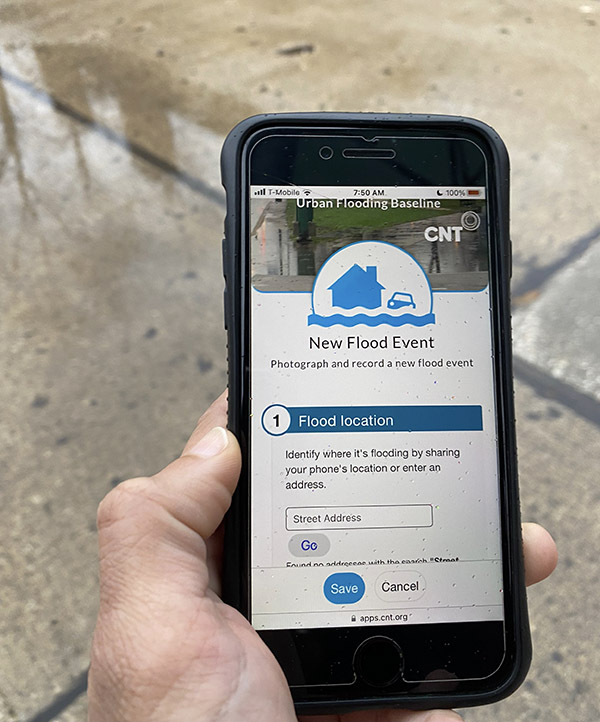
Community Data Collection (Mobile App)
I designed a companion mobile experience that enable residents to document flooding events directly from the field.
The app allows users to:
- Upload geotagged flood photos
- Record contextual details including water depth, timing, and impact
- Contribute to a growing community-informed dataset
This approach addressed systemic gaps in traditional reporting by:
- Centering community voices
- Building trust through compensated participation
- Expanding data coverage in underrepresented areas
By integrating resident-reported experiences alongside institutional datasets, the platform helped address reporting gaps while creating a more complete picture of flood risk across underrepresented communities.
Impact
The Urban Flooding Baseline platform transformed fragmented environmental and community-reported data into an accessible public-facing resource for advocacy, planning, and education.
The Urban Flooding Baseline Tool helped:
- Support municipalities exploring localized flood vulnerability
- Equip community organizations with data for advocacy and funding conversations
- Demonstrate how qualitative community reporting can strengthen traditional GIS analysis
- Create a more accessible model for communicating environmental equity issues through interactive storytelling
Visit the website: